


Many fleets still run on conversation: a daily stream of calls, texts, and check-ins just to confirm where equipment is, what is available, and what is ready to work. That coordination tax is expensive, and it scales with every jobsite, move, and asset class.
The goal is to replace that noise with a reliable operating picture, and a few repeatable workflows that keep it current. This guide lays out how to do that, from data ingestion and harmonization to full-fleet coverage and benchmarking that holds up across sites and equipment types.
Construction fleet tracking is the operating discipline of connecting assets, jobsites, and decisions with consistent signals about location, movement, usage, and readiness. The “tracking” part is the starting point, not the finish line. The business objective is to reduce uncertainty in daily execution: where assets are, which ones are available, what needs service next, and what is drifting off plan.
In high-performing organizations,, construction fleet tracking functions like an operational control layer across the equipment portfolio. It supports dispatch speed and accuracy, protects uptime through service planning, and creates a defensible view of utilization so the fleet can be sized and deployed intentionally. When those outcomes are present, the program earns adoption in the field and credibility with leadership because it reduces friction without adding administrative burden.
The definition matters because it prevents a common failure mode: investing in connectivity, then stopping at visibility. Visibility without consistent definitions, workflows, and accountability produces dashboards that are interesting but not decisive. Real ROI appears when tracking becomes part of how work gets executed, not a parallel reporting system.
Construction fleets rarely lose value in one dramatic event. They leak value through repeated micro-inefficiencies: crews waiting on iron, supervisors searching for the right attachment, unplanned moves, service executed late because hours are unclear, and rental decisions made under time pressure because availability is uncertain.
Construction fleet tracking delivers ROI by tightening those decision loops. The highest-confidence value drivers tend to be operational, measurable, and owned by specific teams:
Some of the most durable ROI comes from eliminating waste that is visible only when usage signals are consistent and comparable across the fleet. Idling is a prime example: it consumes fuel, adds wear, and distorts utilization, yet often goes unmanaged because it is hard to measure uniformly across brands, sites, and job types.
AEM estimates that 10–30% of fuel consumed by construction equipment can be nonproductive idling, and that telematics-enabled idle management can reduce nonproductive idling by 10–15% on average.
That is precisely where tracking fundamentals and benchmarking become financially meaningful. Once idle and usage metrics are normalized by equipment class and site, leaders can distinguish between inevitable idle and preventable idle, then act through planning standards, operator coaching, and dispatch discipline.
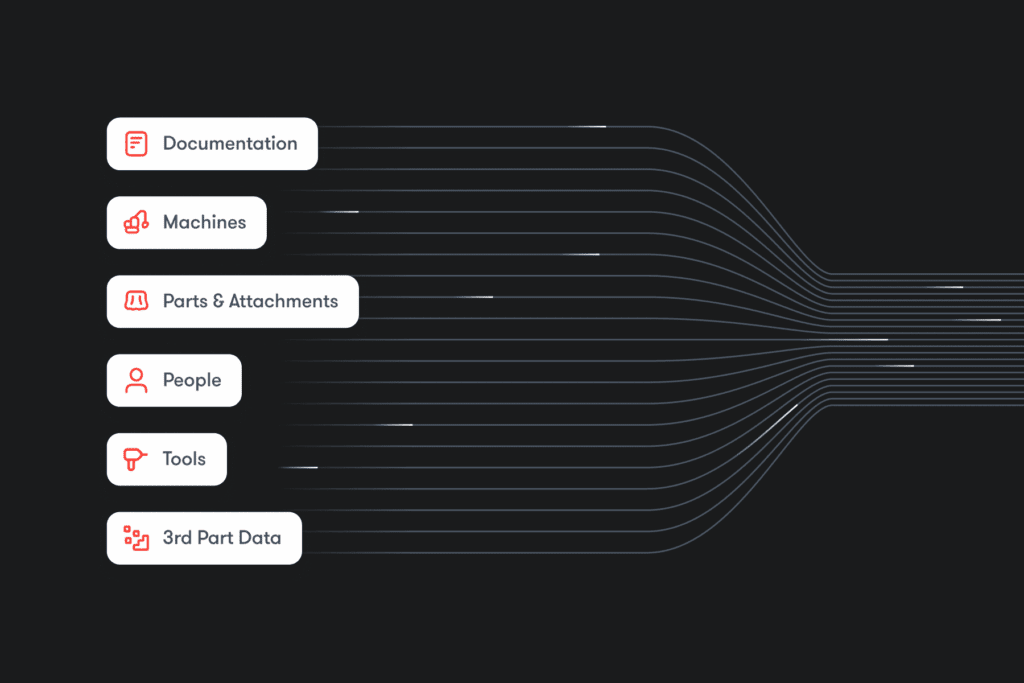
Construction fleet tracking begins with ingestion, but the central challenge is not access. It is consistency. Most fleets ingest data through two paths: OEM data feeds and independent devices. Both add value, but they behave differently in a mixed fleet.
OEM data feeds can provide useful signals such as location, operating hours, and selected machine status elements. The constraint is that field sets, definitions, update behavior, and data quality can vary by manufacturer, model, and configuration. In practice, the OEM controls what is exposed, how it is represented, and how uniformly it behaves across a portfolio. That makes OEM feeds a meaningful input, but not a guarantee of fleet-wide comparability.
Independent devices solve a different problem. Devices create a layer the fleet controls, producing standardized signals with predictable behavior across brands and asset types. This is particularly important for trailers, towables, unpowered assets, and the long tail of equipment where OEM-provided data is limited or inconsistent. Devices may not always deliver the same depth of machine-specific context, but they deliver a more valuable operational property: consistent data that can be applied everywhere.
A scalable ingestion approach treats OEM feeds as an enrichment layer and devices as a consistency layer. The objective is decision-grade coverage: complete asset visibility, comparable measures, and dependable timeliness so operational teams stop debating data and start acting on it.
Berg Insight forecasts the global installed base of active construction equipment OEM telematics systems will reach 12.1 million units by 2028, growing at about a 12% CAGR.
As connectivity scales, the management challenge increases. More connected assets do not automatically produce better decisions. They produce more signals, and without harmonization and governance, more signals can translate into more inconsistency.
Ingestion moves data into the environment. Harmonization makes that data usable across a mixed fleet. Without harmonization, construction fleet tracking becomes fragmented: multiple tools, conflicting answers, and inconsistent reporting that drains trust. Harmonization solves the “many inputs, one fleet” problem by converting raw signals into a single operational truth.
This is the point where the data platform becomes central. In this context, a platform is the software layer that sits above data sources (devices, OEM feeds, tool networks) and converts raw signals into an operating view of the fleet. It is where asset identity is governed, where definitions are enforced (for example, what “on site” means, how hours normalize, what constitutes a movement exception), and where insights are distributed by role across dispatch, field leadership, maintenance, and executive management. Without that layer, fleets default to parallel systems and manual reconciliation, which slows execution and weakens accountability.
Harmonization typically requires four capabilities to be reliable at scale:
Industry standards help reduce translation work and improve interoperability. ISO/TS 15143-3 is described as a communication schema designed to provide mobile machinery status data from a telematics provider’s server to customer applications via the internet.
The need for harmonization is reinforced by industry observations: connectivity is growing faster than standardization, leaving many fleets with multiple portals and inconsistent reporting.
Data standardization out of the box still isn’t the norm across construction fleets. In 2022, Construction Equipment reported that in-house monitoring based on ISO/TS 15143-3:2020 was limited to roughly 14% adoption. While progress has been made since, many fleets still rely on individual OEM dashboards or third parties. This setup makes consistent cross-fleet reporting and benchmarking far harder.
Harmonization is what makes tracking operational. With consistent definitions and clear data quality, teams spend less time validating numbers and more time acting on them. That stability enables safe automation and trusted reporting.
With ingestion and harmonization in place, construction fleet tracking stands on a small set of fundamentals. This is not the “basic” layer. It is the minimum dataset that supports operational decisions across dispatch, field execution, and maintenance.
The most effective programs standardize four fundamentals across the fleet.
Location with history. Real-time position matters, but location history is what makes tracking operational. History supports accountability, reconstructs moves, and validates whether assets are where they are supposed to be across shifts and projects.
Movement and exceptions. Movement becomes valuable when it is treated as exception handling: arrival, departure, after-hours movement, unexpected departures, and long dwell off plan. The goal is not to generate more alerts. The goal is to generate fewer, higher-confidence alerts tied to a response.
Usage signals. Operating hours and utilization proxies provide the bridge from visibility to maintenance and cost control. Perfect utilization definitions are not required on day one. What matters is consistency: a repeatable usage measure that supports decisions to redeploy, retain, rent, or retire.
Readiness. Readiness consolidates operational status into a simple question: can the asset go to work now, and if not, what blocks it? Service due, down, in transit, unassigned, or missing all have different operational responses. Readiness makes those responses visible and measurable.
The delivery of these fundamentals is as important as the dataset. Operational teams do not adopt tracking because reports exist. Adoption follows when tracking reduces coordination time and clarifies action. Dispatch needs availability and proximity. Field leadership needs site inventory and exceptions. Maintenance needs service triggers and readiness. When fundamentals are distributed as role-based actions rather than generic dashboards, tracking becomes part of execution.
Advanced capability becomes meaningful only once the basics are stable: consistent ingestion, harmonized definitions, and a minimum operational dataset that teams use daily. At that point, the limiting factor shifts from data availability to decision scalability. The organization moves from knowing what is happening to running the fleet with repeatable, comparable management logic.
This is where advanced setup delivers real value. It is not “more reports.” It is the ability to ask more specific questions and receive credible answers without rebuilding logic for every site, OEM, or equipment class. When harmonization is strong, the same dataset can be analyzed by equipment type, model, site, region, project, and time window, producing comparisons that hold up operationally and financially.
Advanced analytics typically matures in three layers, each building on the last.
Operational analytics (near-term control) strengthens daily execution. It surfaces exceptions that require action, recurring move friction, dwell time that indicates misallocation, and readiness bottlenecks that slow dispatch. The practical value is fewer surprises, faster response, and tighter coordination between yard, field, and shop.
Performance analytics (repeatable improvement) turns recurring patterns into structured improvement. Utilization by class and site becomes meaningful when it is measured consistently. Idle hotspots become a planning and behavior problem that can be addressed through standards and coaching. Maintenance execution becomes measurable through PM compliance and downtime patterns, shifting the organization from reactive repairs to managed readiness.
Benchmarking (decision-grade comparisons) is a higher leverage layer, and it depends on comparability. Benchmarking compares normalized measures across sites, equipment types, and models to identify outliers and isolate what is actually driving results. It supports executive decisions with evidence: where a region consistently underperforms on readiness, where a site runs the same class with lower idle, which models deliver stronger utilization under comparable conditions, and which job profiles generate avoidable moves. With a credible benchmark, improvement becomes targeted rather than generalized, and standardization becomes practical rather than ideological.
The outcome is a program that compounds. Strong fundamentals drive adoption. A coherent platform turns adoption into repeatable execution. Advanced analytics and benchmarking then convert execution into continuous improvement, linking day-to-day fleet control with longer-term decisions on capex, rental strategy, maintenance capacity, and operating standards.
Fleet tracking cannot remain confined to heavy equipment if the goal is operational control. The most persistent friction in construction often comes from the assets that sit below the top tier: trailers that drift, towables that move constantly, attachments that are essential but unmanaged, and tools that disappear quietly until production stops. Full-fleet visibility is less about tracking everything the same way and more about designing connectivity that matches the reality of each tier.
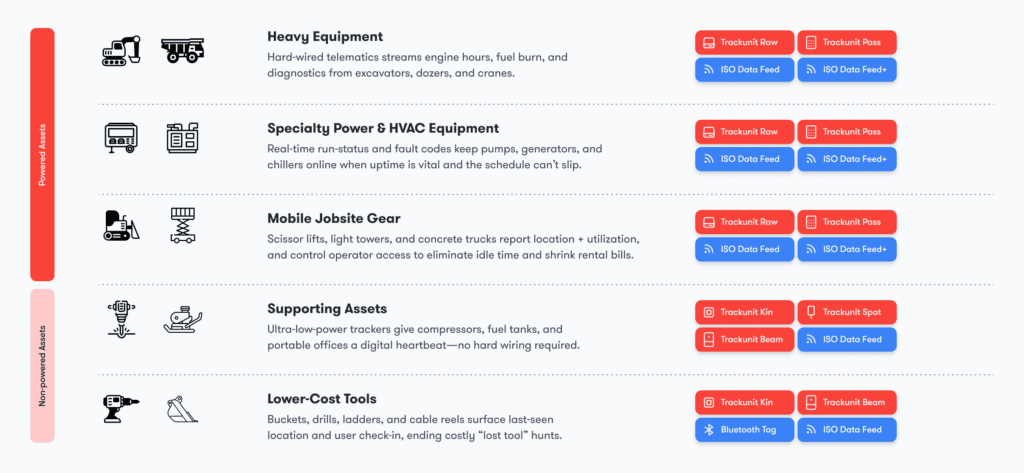
A practical approach is to build a coverage pyramid: different tracking strategies by tier, all feeding the same harmonized model so the fleet can be managed as one system.
Tier 1: Heavy equipment (high impact, decision-grade telemetry). Heavy equipment requires the most decision-grade signals because it drives production and cost at the highest magnitude. The minimum dataset is location history, movement exceptions, usage signals, and readiness. Depth can increase with richer status data, but consistency across the mixed fleet is what enables comparable analytics and trustworthy utilization.
Tier 2: Light equipment, towables, and trailers (high movement, high leakage risk). This tier creates disproportionate operational leakage because it moves frequently and is often managed informally. The minimum dataset centers on location history, movement events, and site presence with actionable exceptions. Standardized device-based tracking often plays a strong role here because uniform signals matter more than deep machine context.
Tier 3: Tools and powered tools (high volume, different network). Tool-level visibility is the hardest to scale and the most commonly neglected. GPS is rarely practical for every tool, and treating tools like miniature machines creates cost and maintenance overhead. Tool coverage typically requires a different connectivity model: Bluetooth tags paired with a locator network and software that treats tools as first-class assets. The Bluetooth SIG’s Asset Tracking Profile defines procedures used by a Bluetooth Low Energy device (locator) to find the relative direction and optionally the location of another BLE device (asset tag).
Tool tracking succeeds when the operating model is clear. Most organizations need presence, last-seen, and exceptions more than continuous real-time movement. That requires a deliberate network strategy (where locators sit across yards, sites, containers, and vehicles), tag selection that fits construction realities, and software workflows aligned to issuance, returns, kits, and exceptions.
Full coverage is not a hardware milestone. It is a design principle. When the equipment pyramid is visible in one harmonized system, readiness becomes measurable across the entire work package, not just the iron.
Construction sites punish assumptions that hold true on-road. Connectivity can be inconsistent. Jobsites change frequently. Multiple operators share assets. GPS accuracy can degrade near structures and in dense environments. If a tracking program expects perfect conditions, it generates noise and loses adoption.
Resilient construction fleet tracking prioritizes three traits. First, it treats location history as foundational, not optional. Second, it designs exceptions carefully so alerts correlate with action and ownership. Third, it distributes insights by role. Dispatch, superintendents, yard managers, and maintenance teams need different views and different thresholds. Without role-based design, alerts either overwhelm teams or get ignored entirely.
These realities also reinforce the importance of freshness indicators and data quality flags. Operational decisions should not be driven by stale location or inconsistent hours. A platform that makes freshness explicit protects the organization from false certainty.
Standards-based exchange is one mechanism for reducing that tax. ISO/TS 15143-3 defines a common communication schema intended to deliver mobile machinery status data from a telematics provider’s server to customer applications via the internet, which helps create more consistent cross-fleet consumption and reduces one-off integrations.
The practical benefit is comparability. When core fields such as location, operating hours, and status events can be expressed in a consistent structure, a mixed fleet becomes easier to manage as one system. Reporting stabilizes because metrics are built on standardized inputs rather than custom mappings by OEM, model year, or site. Over time, that reduces the administrative burden of adding new equipment types and helps leadership trust cross-fleet benchmarks.
Standards do not remove the need for governance. They reduce friction at the data layer, but fleets still need a platform that enforces asset identity, data freshness, and consistent definitions across workflows. That combination is what turns interoperability into operational speed, rather than another integration project.
Construction fleet tracking does not operationalize itself. The difference between a tracking tool and a tracking program is governance: decision rights, ownership, and cadence.
Governance begins with decision rights. Asset movement decisions need a clear owner. Maintenance readiness decisions need a clear owner. Loss-response decisions need a clear owner. Then governance defines alert ownership: every alert type needs a responsible role, an expected response time, and an escalation path. Finally, governance sets an operating cadence that converts data into action: short operational reviews for exceptions and moves, maintenance readiness reviews tied to service windows, and leadership reviews anchored on a small KPI set.
Closed-loop execution is the test. Service thresholds should generate planned work, not reminders. Unauthorized movement should generate response, not noise. When workflows close the loop, tracking earns trust and becomes part of how the fleet is managed.
Fleet tracking programs succeed when they measure what matters and measure it consistently. High-performing organizations limit KPIs to a manageable set tied to uptime, cost, and schedule performance.
A practical KPI set includes time-to-locate, move cycle time, utilization by class, idle rate by class and site, PM compliance, planned versus unplanned downtime hours, and unauthorized movement events with resolution time. For risk framing, the National Equipment Register cites research estimates that annual heavy equipment theft totals approximately $300 million to $1 billion, which reinforces why unauthorized movement alerts and response-time KPIs belong in the core scorecard, not as an edge case.
Cadence matters. Weekly cadence supports operational control. Monthly cadence supports trend management and investment decisions. Quarterly cadence supports standardization and policy changes. The KPI set should align to those decision cycles.
Most failures in construction fleet tracking are predictable. They are rarely caused by a lack of features. They are caused by inconsistent data, weak operating design, and incomplete coverage.
A common pitfall is treating tracking as a map instead of a workflow. The prevention is to define the decisions that tracking should improve, then configure alerts, exceptions, and role views around those decisions. Another pitfall is incomplete coverage, especially in towables, trailers, attachments, and tools. The prevention is the coverage pyramid: track what creates friction, not just what is expensive.
Data governance is another frequent issue. Inconsistent naming, unclear asset hierarchy, and missing freshness indicators erode trust quickly. Alert fatigue is equally damaging and is best prevented by starting with a small set of high-confidence alerts that have owners and response paths, then expanding deliberately.
Finally, benchmarking too early creates confusion. Benchmarking only becomes valuable when measures are normalized and comparable across the mixed fleet.
The right construction fleet tracking system is the one that supports the fleet’s coverage goals and operating model, and can harmonize mixed inputs into one trustworthy dataset. A feature checklist does not answer that. A decision framework does.
Selection is best approached as an evaluation of capabilities that determine long-term scalability:
A pilot should validate outcomes, not just connectivity. The most useful pilots test time-to-locate reduction, move coordination improvement, PM compliance improvement without manual hour chasing, and meaningful coverage in the tiers that drive daily friction. If the operating outcomes do not move in a pilot, scale will not fix it.
Construction fleet tracking is the system and operating discipline that connects asset location, movement, usage signals, and readiness to dispatch, maintenance, and jobsite decisions across the full fleet, not only heavy equipment.
OEM feeds can provide valuable signals, but they can be constrained by what the manufacturer exposes and how consistently it updates across models and configurations. In mixed fleets, the practical approach is to use OEM feeds as enrichment while ensuring harmonization delivers comparable measures fleet-wide.
Because mixed inputs produce mixed definitions. Harmonization normalizes identity, definitions, and freshness so teams can trust dashboards, automation, and benchmarking. ISO/TS 15143-3 is described as a schema designed to provide mobile machinery status data from a telematics provider’s server to customer applications via the internet. Source: ISO — ISO/TS 15143-3:2020 overview
Location history, movement exceptions, usage signals that support maintenance planning, and readiness. These fundamentals support dispatch speed, reduce unplanned moves, and tighten PM execution.
Location history, movement exceptions, usage signals that support maintenance planning, and readiness. These fundamentals support dispatch speed, reduce unplanned moves, and tighten PM execution.
It matches tracking depth and connectivity to asset tiers. Heavy equipment needs decision-grade telemetry. Towables and trailers need standardized location and movement. Tools typically require a Bluetooth tag and locator network to provide presence and last-seen visibility at scale.
Bluetooth’s Asset Tracking Profile defines procedures used by a locator device to find the relative direction and optionally the location of an asset tag, enabling scalable locator-and-tag patterns.
Interoperability reduces fragmentation, accelerates onboarding of new asset types, and supports consistent KPIs. ISO/TS 15143-3 and related industry efforts are intended to support standardized exchange of machinery status data to customer applications.
Tracking improves detection of abnormal movement, shortens response windows, and supports recovery workflows with event history and last-known location. NER cites research estimates that $300 million to $1 billion in heavy equipment is stolen annually, underscoring the value of faster detection and response.
Build one trusted fleet dataset before chasing sophistication. Prioritize harmonization: consistent asset identity, clear data freshness, and standardized definitions for location events, hours, usage, and readiness. Without this layer, analytics becomes reconciliation and benchmarking becomes debate.
Make the fundamentals operational, not informational. Treat location history, movement exceptions, usage signals, and readiness as the minimum management dataset. Deliver them through role-based workflows for dispatch, field operations, and maintenance so the system reduces coordination time instead of adding reporting overhead.
Design for full coverage across the equipment pyramid. Heavy equipment is necessary but not sufficient. Close the visibility gaps in trailers, towables, attachments, and tools with the right connectivity model for each tier. Full coverage is what prevents daily execution from being derailed by “missing” components of the work package.
Use analytics to standardize performance, not just observe it. Once measures are comparable, apply analytics and benchmarking across equipment classes, models, and sites to identify outliers and codify operating standards. The objective is repeatable improvement in utilization, idle, downtime, and move efficiency.
Run the program with ownership and cadence. Assign decision rights for moves, service, and loss response. Define alert ownership and escalation. Anchor the program on a small KPI set tied to dispatch speed, utilization, idle, PM compliance, downtime, and unauthorized movement response time. This is what converts tracking from visibility into control.
Construction fleet tracking delivers real ROI fast when it is built as an operating system, not a device rollout. Start with a control vs. constraint ingestion strategy, then invest in harmonization so the fleet runs on one truth. Standardize the fundamentals, location history, movement exceptions, usage, and readiness, and distribute them through role-based workflows with clear ownership. From there, advanced analytics and benchmarking become credible, and full coverage across the equipment pyramid becomes achievable, including tools through Bluetooth networks, tags, and software. That combination turns visibility into control, and control into performance.