
Most construction businesses already have more data than they can act on. The challenge is moving from raw machine signals to decisions that reach the right person at the right moment, without manual steps in between. That journey has five stages, and each one builds on the last.
There are five stages to that journey, and each one builds on the last:
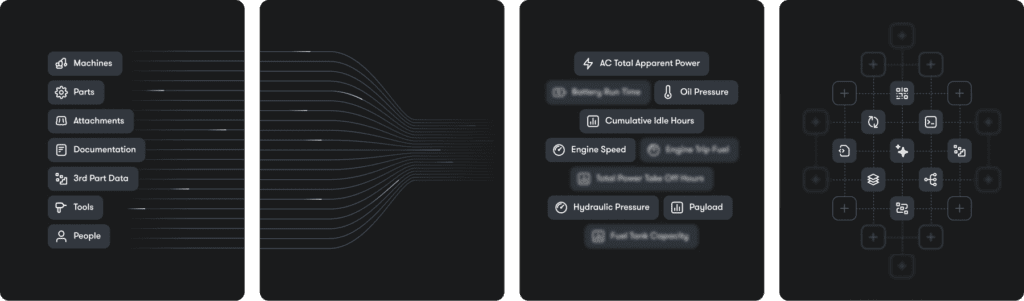
IrisX is Trackunit’s Construction Operating Data Platform for off-highway construction fleets. It powers telematics and fleet management by turning fragmented machine and business data into structured, AI-ready intelligence.
IrisX is the platform that runs beneath all five stages. It standardizes, queries, triggers, automates, and surfaces insights, all from a single governed data layer.
Because IrisX is construction-specific, it works across every OEM brand and asset type without custom development. The platform processes 3 billion data points per day across 6 million connected assets. It also draws on two decades of construction-specific context, which is what makes mixed-fleet data usable at scale.
Most construction fleets run machines from multiple OEMs. However, each one uses different data formats, identifiers, and schemas.
Without a governed layer, most data projects spend 30 to 40% of their effort just on modeling and preparing data, according to Trackunit’s experience. That happens before any analysis can start.
IrisX uses a construction-specific schema that standardizes data across every brand before the user logs in. As a result, fault codes from any manufacturer land in the same format, ready for the same query.
Building custom pipelines for each brand creates maintenance debt that breaks with every firmware update. IrisX therefore eliminates that entirely.
What used to take three to six months now takes four to six weeks. OEMs and fleet owners have saved over $200,000 per IT project by eliminating custom pipelines, according to Trackunit’s experience.
Many operational teams can’t write SQL or build a notebook. However, that bottleneck disappears with AI-assisted analytics.
Instead, users ask natural language questions against their fleet data and receive structured answers without writing code. The platform generates the query, runs it against the lakehouse, and returns a result with a visualization.
The speed difference is material. For example, one fleet owner answered a depot reallocation question in two minutes using IrisX MCP.
Previously, the same question required pulling reports and cleaning data across systems, a process that took days. One mid-sized rental company deployed an IrisX fault code expert across a 2,000-machine fleet. Troubleshooting time fell by 30%, saving over $150,000 in annual labor costs.
Teams can also connect directly to Databricks, Power BI, or Tableau and go straight to analysis.
Knowing something is true isn’t the same as knowing when to act. A machine returning to a depot after a rental period is an event.
That event should automatically trigger a service check and notify the right technician, without anyone opening a dashboard.
IrisX uses webhooks and event-based automation to make this happen. When a defined condition occurs, the platform pushes an update in real time with no polling needed.
An asset entering a depot fires the trigger immediately. A fault code crossing a threshold does the same. As a result, teams no longer chase data. The data reaches them at the moment it matters.
The final automation stage is where the decision executes itself. No phone call, no manual data check, no spreadsheet.
Trackunit’s Automation Studio provides a no-code visual workspace for building these workflows. Users connect triggers, data sources, and actions into recipes.
Additionally, IrisX connects to over 1,200 systems through packaged connectors, including Salesforce, SAP, and most major CRM and ERP platforms.
The Smart Servicing blueprint has helped rental companies cut machine turnaround time by up to 50%. A regional rental operator with a 2,000-machine fleet saved around $100,000 in annual labor costs. Furthermore, one specialist rental company running 5,000 machines gained more than $1 million by reducing machine downtime between jobs.
The Out-of-Contract Usage blueprint surfaced approximately $2 million in previously missed invoices for one Trackunit rental customer. An automated workflow replaced weeks of manual reconciliation, triggered the moment a machine exceeded its agreed usage terms.
Based on Trackunit customer data, proactively communicating billing gaps produces around 10% higher customer retention. The automation doesn’t replace the depot manager, it gives them a basis for faster, more confident decisions.
The fifth stage is where the data loop closes back on the business itself. Each segment reaches it differently, and the detail of what it looks like in practice is covered in the vertical sections below.
At this stage, the data that has been standardized, queried, triggered, and automated becomes a competitive asset. Rental companies recover revenue and improve retention. OEMs build better products and grow aftermarket margins. Contractors deliver on-time, on-budget projects with full asset visibility.
Rental machines generate data every hour they run, across every OEM, every branch, and every contract. Most of that data sits unused, brand by brand, branch by branch, never turned into a decision.
The cost shows up at the billing layer. Machines exceed contract terms every day across most large fleets, yet most teams never see it.
IrisX MCP gives rental teams a direct line from question to answer in seconds. Answers about contract violations, idle assets, and service status reach the commercial team before the billing cycle closes.
At the automation stage, the Out-of-Contract Usage blueprint flags overruns automatically and triggers a Salesforce task the moment a machine exceeds its agreed terms. Based on Trackunit customer data, proactively communicating those billing gaps produces around 10% higher customer retention.
At the optimization stage, one specialist rental company running 5,000 machines gained more than $1 million by reducing downtime between jobs with the help of IrisX.
OEM machines generate data from the moment they leave the factory floor. Most of it never comes back in a form that can turn into value.
The standardization stage changes that. IrisX harmonizes field data from every machine in the installed base, so warranty teams, service engineers, and product managers can query live signals from the AI tools they already use.
At the analysis stage, fault patterns, regional usage differences, and duty cycle data surface in seconds rather than weeks. R&D teams replace assumptions built on design averages with data from machines actually in the field.
Furthermore, Deloitte research indicates that businesses with high aftermarket data maturity generate approximately 2.5 times higher operating margins than those without. The Data-Driven Product Design blueprint surfaces real-world load and usage patterns so product teams can act on that advantage.

Contractors own and rent equipment across every project and every site. Most of that data never reaches the people who could act on it.
Most job sites still run on manual check-ins and spreadsheets. Owned and rented assets live in separate systems, so deployment decisions get made with half the picture.
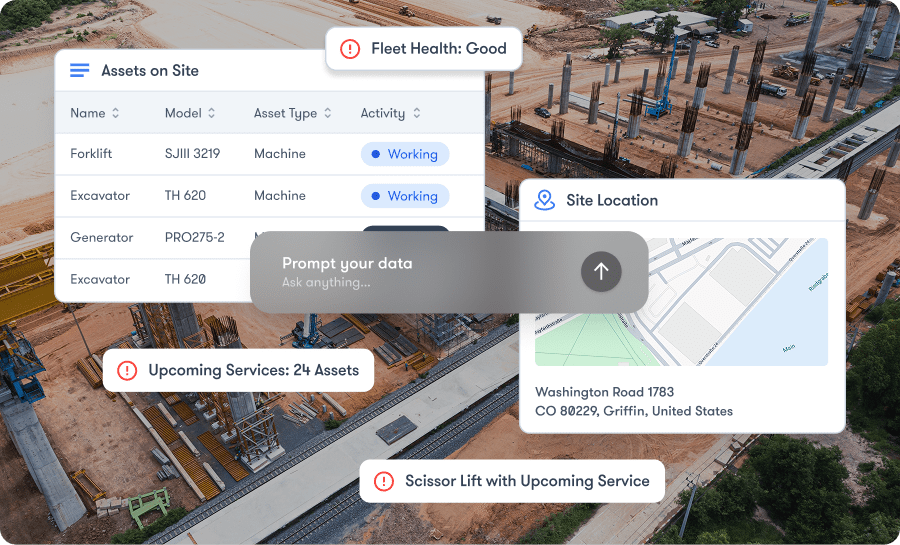
At the standardization stage, IrisX maps every asset — owned and rented — into a single governed view. Project managers and site supervisors can then ask plain-language questions about utilization, idle time, and upcoming maintenance across every site.
At the alert stage, maintenance needs and idle cost anomalies surface automatically before they compound. The Site Optimization for Idle Cost blueprint surfaces daily idle cost per site with a built-in action list.
One rental operator reduced idle hours by 10 to 20% using it. That saved approximately $300,000 per year.
The five stages don’t require a single large implementation. Instead, businesses can start where their data maturity sits and grow from there.
Starting at stage one means teams can see which machines are used out of contract. That alone supports better customer conversations and, according to Trackunit’s experience, correlates with higher retention. Each stage creates value independently, so businesses don’t need to reach full automation to see impact.
Want to see how the IrisX operating data platform can help you find a faster path to value? Book your demo
Collecting fleet data means capturing signals from machines and operational systems. Acting on it means those signals reach a decision or trigger a workflow without manual steps in between. The gap between the two is where most operational costs compound.
Data stays unused because of fragmentation across brands and preparation work that takes too long. No trigger exists to push insights when they matter. IrisX addresses each layer in sequence, moving from standardized data to AI-assisted queries to automated workflows.
No data science team is required. IrisX supports natural language queries so operational teams can ask questions without writing code, and ready-to-deploy blueprints cover the most common use cases without any technical setup. Teams can activate a blueprint and see measurable impact within weeks.
Yes. Mixed fleet data is the default in construction. IrisX uses a construction-specific schema, so fault codes and machine signals from different manufacturers land in the same format, ready for the same query.
What used to take three to six months now takes four to six weeks. That reduction comes from a pre-standardized data layer, which removes the modeling and preparation work that accounts for 30 to 40% of a typical project’s timeline.
Connect IoT utilization data to agreed contract thresholds. The Out-of-Contract Usage blueprint flags overruns automatically, quantifies the revenue opportunity, and triggers actions in a CRM or ERP. One Trackunit rental customer surfaced approximately $2 million in previously missed invoices this way.
The Site Optimization for Idle Cost blueprint gives every site a real idle cost figure. It ranks machines by highest cost, with a built-in action list. Rental operators using this approach have reduced idle hours by 10 to 20%, saving over $300,000 per year on a mid-sized fleet.
Yes. IrisX supports over 1,200 packaged connectors, including Salesforce, SAP, and major CRM and ERP systems. It feeds real-time machine data into existing systems of record rather than replacing them.
A blueprint is a working solution that activates against live data already in the platform. Teams can activate one in days without custom development. Use cases span smart servicing, out-of-contract usage, idle cost, battery management, and product design.
Benoît Guibert is a Product Marketing Manager for IrisX at Trackunit, focused on turning construction data into practical, real-world solutions. He brings experience across SaaS, cloud, and digital platforms, helping translate complex technology into clear business value.