


In construction, equipment decisions are made continuously: what to buy, what to rent, what to move, and what to retire. Fleet utilization can sound like another KPI, but it’s one of the few signals that cuts across operations, maintenance, and finance. Measured consistently, it shows whether the fleet you carry matches the work you run.
Below, we define fleet utilization, show how it’s calculated, outline what drives it up or down in construction, and explain how organizations benchmark utilization in a way that supports better fleet decisions.
Fleet utilization is a measure of how much of your fleet’s available time is spent performing productive work. In construction terms, it’s the percentage of “could be working” hours that become “did work” hours.
A practical way to frame it is the relationship between available time and productive time. Available time is the window where an asset could be used based on your shift patterns and operating rules. Productive time is the portion of that window where the asset is performing useful work, not simply powered on and not simply present on site.
Industry guidance often describes utilization hours as the hours equipment operates performing construction work, because those are the hours that recover the investment and keep the business profitable.
In construction, fleet utilization is difficult to measure consistently in construction because “productive work” and “available time” are not uniform across the fleet.
That’s why high-performing fleet organizations treat utilization as a system, not a single number.
When construction teams talk about utilization, they’re usually trying to answer one question: how much of the time we planned to have an asset working did it actually spend doing productive work? It sounds straightforward, until it gets confused with availability and uptime.
A useful way to separate the three is to focus on what each metric is actually describing.
Utilization
What it describes: How much of scheduled time is spent productively working
What it helps you decide: Fleet size, redeployment, rent vs. own decisions, cost recovery
Availability
What it describes: How much of scheduled time the machine is mechanically able to work
What it helps you decide: Maintenance strategy, reliability, workshop planning
Uptime
What it describes: A broader “running” or “online” concept that varies by system
What it helps you decide: Connectivity health, operational readiness, service performance
In equipment productivity analysis, utilization is commonly expressed using Scheduled Machine Hours (SMH) and Productive Machine Hours (PMH). SMH is the time the machine is scheduled to work. PMH is the time the machine actually performs work, excluding both mechanical and non‑mechanical delays.
That leads to a definition that is both practical and measurable:
Utilization (%) = (PMH / SMH) × 100.
Mechanical availability is the percentage of scheduled time a machine is mechanically able to perform work. A simple operating principle follows: utilization cannot exceed mechanical availability. If availability is low, utilization is capped regardless of how well work is scheduled.
The distinction matters because it prevents the most common misdiagnosis in fleet performance reviews:
This is where utilization becomes more than a KPI. It becomes a shared language between operations, maintenance, and finance.
Fleet utilization is typically calculated as productive hours divided by scheduled (or available) hours, expressed as a percentage. The key is consistency: define what “scheduled/available time” means in your operation, and define what qualifies as “productive work.”:
A widely used time model in equipment productivity is based on Scheduled Machine Hours (SMH) and Productive Machine Hours (PMH). SMH is all time the machine is scheduled to work. PMH is the time the machine actually performs work, excluding time lost to both mechanical and non‑mechanical delays.
That definition is practical because it reflects jobsite reality. It separates “we planned to use it” from “it was actually productive,” and it forces the conversation into the causes of lost time.
Improving fleet utilization is not about pushing machines to work more hours. In construction, the goal is not maximum utilization, but intentional utilization. That means ensuring the right equipment is in the right place, for the right amount of time, without increasing breakdown risk or creating operational friction.
The first lever is availability. If machines are frequently unavailable due to breakdowns or delayed maintenance, utilization will remain low regardless of how well work is planned. Availability sets the upper limit. Utilization shows how effectively that available capacity is converted into productive work.
Beyond availability, the largest utilization losses in construction are non-mechanical. Idle time, waiting for materials or trucks, access constraints, poor sequencing, and mismatched equipment to task all reduce productive hours without appearing as formal downtime. These losses are often invisible unless utilization is broken down into productive and non productive time.
Research from McKinsey supports this view. McKinsey has shown that productivity improvements in construction often come from better planning and coordination, ensuring that equipment, materials, people, and information are ready when work starts rather than reacting to delays once they occur.
In that context, utilization becomes a signal of planning quality, not just asset usage.
Finally, utilization should inform fleet decisions, not just reporting. Consistently underutilized assets point to redeployment, downsizing, or a shift toward rental. Consistently overutilized assets increase wear and downtime risk and may justify additional capacity. When utilization is reviewed regularly and tied to action, it becomes a tool for shaping the fleet rather than simply measuring it.
Once you have SMH and PMH, the calculation is simple:
Utilization (%) = (PMH / SMH) × 100
If you’re building PMH from the ground up, PMH can be treated as scheduled time minus delays:
PMH = SMH − mechanical delays − non‑mechanical delays
This approach keeps utilization from becoming a vague “used/not used” label. It makes lost time measurable and easier to act on.
A quick example: If a machine is scheduled for 10 hours (SMH = 10), but loses 1 hour to a mechanical issue and 2 hours to non‑mechanical delays, then PMH = 7.
Utilization = (7 / 10) × 100 = 70%
The 30% gap is where cost and delay hide, and where utilization becomes a practical management signal rather than a headline number.
That number is useful. But what makes it actionable is what sits behind it. Is the lost time mainly mechanical? That points to maintenance execution and reliability. Is it non‑mechanical? That points to planning, sequencing, logistics, access, or site constraints.
Many fleets use telematics hours as a starting point because it’s scalable. The catch is that not all “hours” mean the same thing, and engine-on time is not the same as productive work.
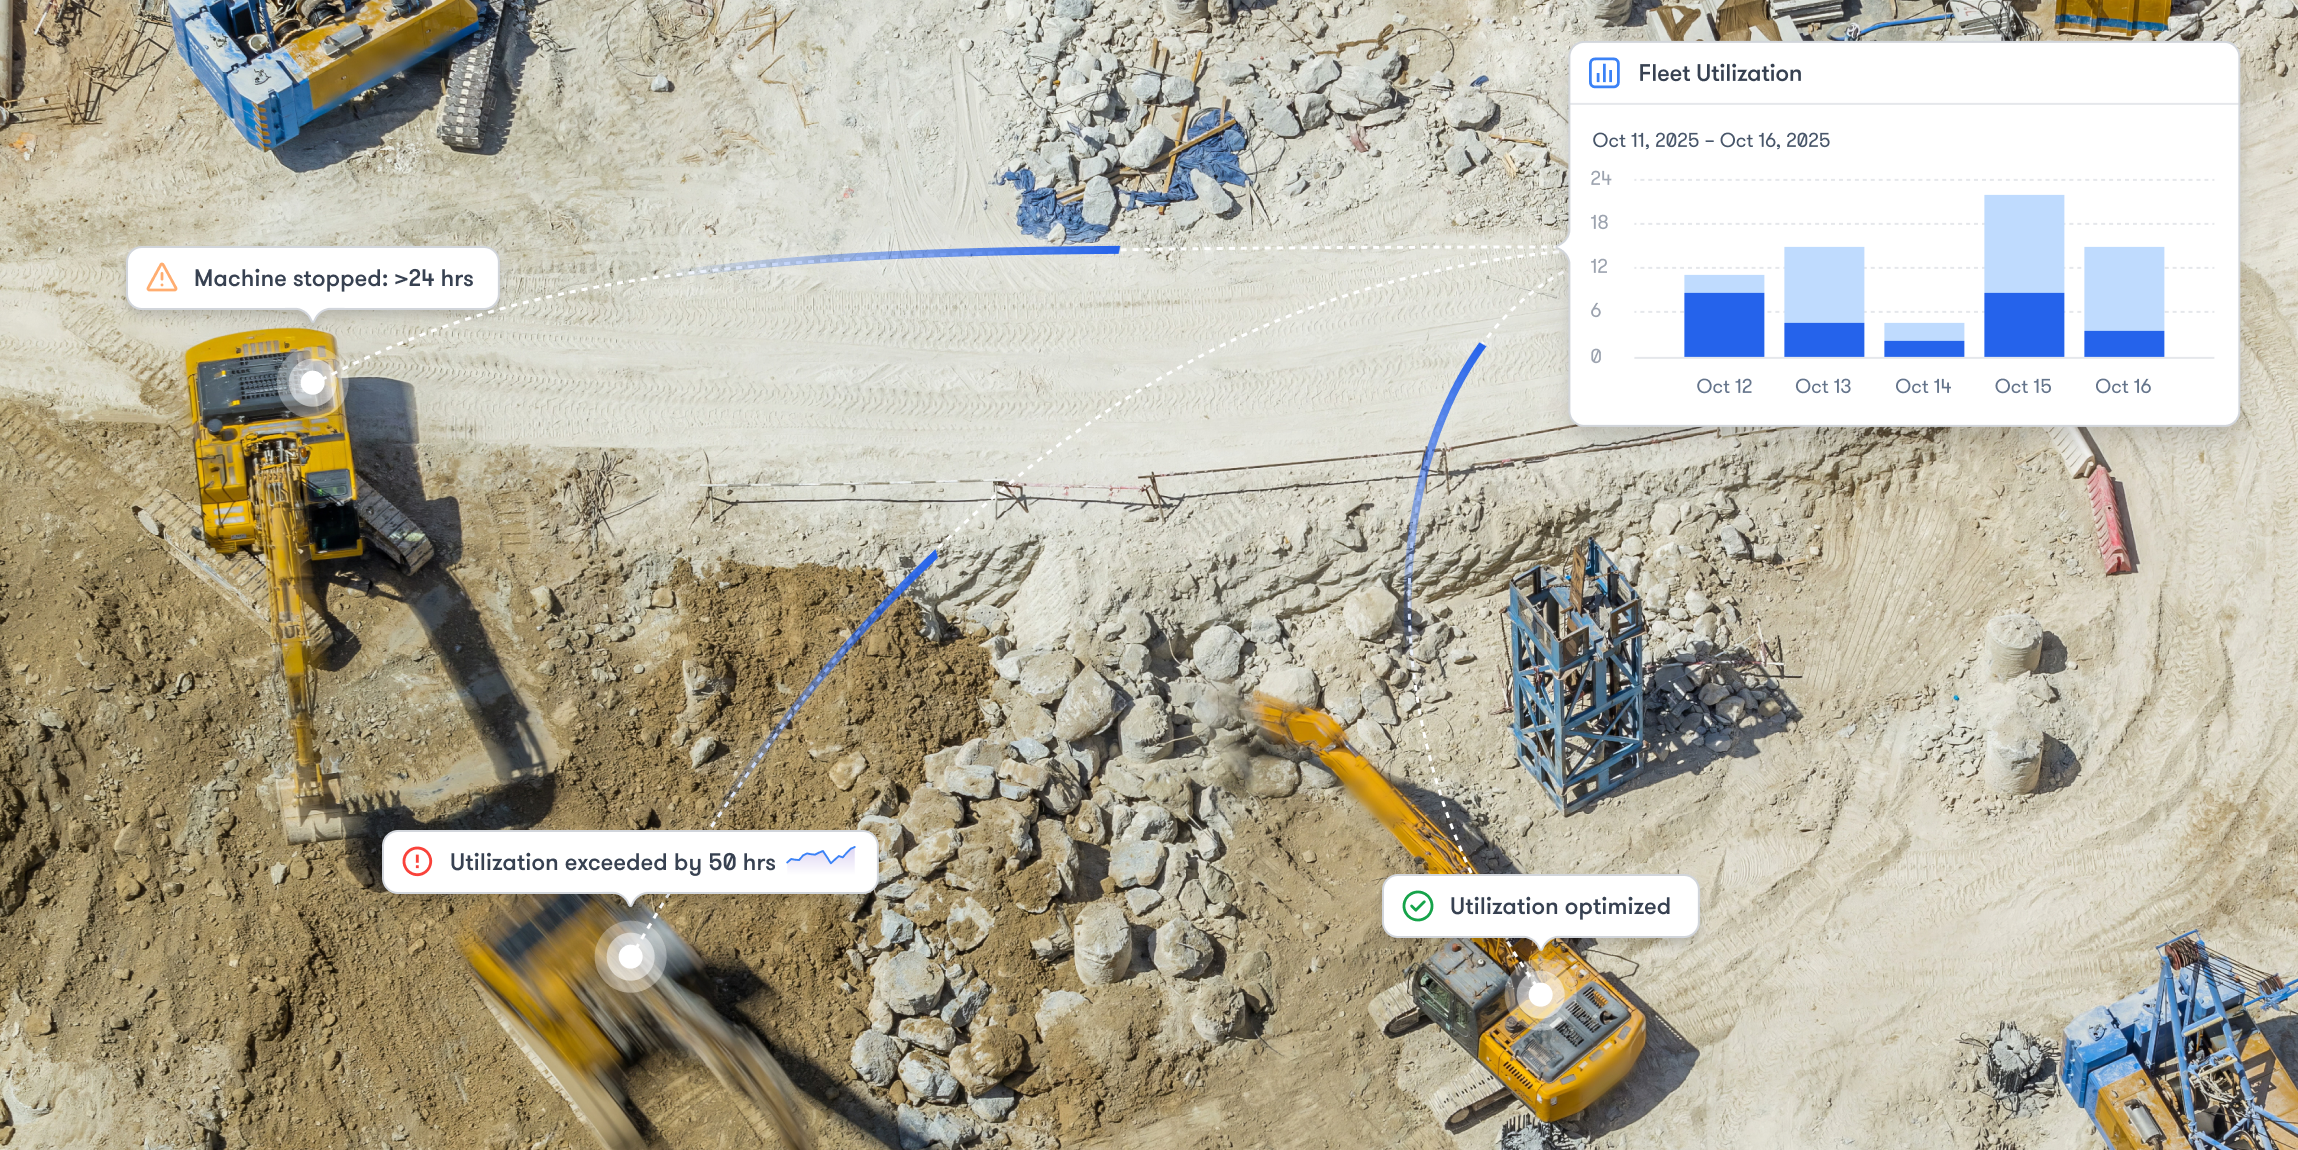
Trackunit’s Utilization reporting makes these distinctions visible when the right data is available:
This matters because the most common utilization mistake in construction is assuming engine-on hours always equal productive work. They don’t. A machine can be powered on, sitting in a queue, waiting on trucks, or idling through delays.
Once you know what to improve, the next challenge is seeing it consistently across the fleet. You can calculate utilization manually, but it is difficult to make it useful at scale. In construction, utilization becomes a decision tool when it can be reviewed consistently across sites, asset types, and ownership models, and when it explains not just how much equipment was used, but where, how, and why productive time was created or lost.
This view is shared by industry leaders focused on digital transformation in construction. Søren Brogaard, CEO of Trackunit, has noted that the industry produces more data than ever, and that making sense of that data is essential to improving efficiency and productivity. In practice, utilization improves when data is not just collected, but turned into clear, actionable insight.
In practice, strong utilization visibility has two layers: structured reporting for review and benchmarking, and an operational view that helps teams act quickly.
1) Structured reporting for review and accountability
A utilization program needs a consistent reporting rhythm. The goal is to review utilization over a defined period, compare actual use to expected targets, and segment results so performance is assessed where decisions are made.
What “good” reporting typically enables:
This level of segmentation matters because utilization is not one decision. It is a series of decisions made at different levels of the organization:
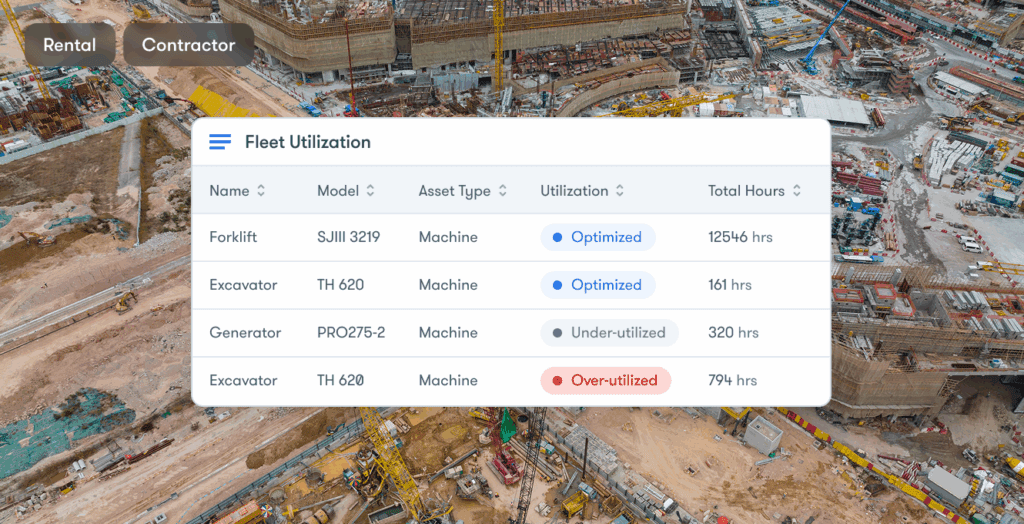
2) An operational view that surfaces exceptions
Reporting helps you understand trends. Operational views help you respond. The most useful utilization views are designed to surface the extremes that drive action: assets that are consistently unused and assets that are consistently overused. When those signals are combined with location and asset context, redeployment decisions become faster and more confident. It also becomes easier to reduce idle time and lower downtime risk created by sustained overuse.
Trackunit is one example of a platform built around these principles. In Trackunit, the reporting and operational views are designed to make utilization actionable across mixed fleets without collapsing everything into a single number.

One constraint applies regardless of tools. Utilization is only as reliable as the data behind it. When data is missing or inconsistent, related analysis and insights are affected as well. That makes data consistency and coverage a prerequisite for any utilization-driven operating rhythm, especially in mixed fleets where information is often fragmented.
A single fleet-wide utilization percentage can be comforting, and almost useless.
Construction fleets are mixed by design. Different asset classes have different duty cycles. Different projects have different phases. Different regions have different weather windows. Even the same machine type can behave differently depending on crew composition, haul distances, access constraints, or subcontractor sequencing.
So the first requirement of any utilization program is the ability to segment the story until it becomes actionable.
This is also why “site-based” utilization matters more than most organizations expect. If you want to improve performance on Site A, you need the utilization picture to reflect what happened on Site A, not what those same machines did elsewhere that week. Trackunit’s Utilization Report explicitly calls this out: when a report is filtered by a specific site, the data shown reflects activity that occurred while assets were physically located at that site, even if those assets were active at other sites during the same period.
Whether you are managing owned assets, rentals, or a customer fleet, that principle holds. Site-based truth creates accountability. It also helps separate “the fleet is busy” from “this project is productive.”
Are we hitting the usage level we planned for?
This is utilization as a commitment. You expected a machine to be active for a certain number of hours a day, and you want to know if reality matches. Trackunit supports this by allowing an anticipated daily utilization target and highlighting days where the machine reached the anticipated utilization.
How much was the machine truly “in use” during the day?
This is where operating hours alone can mislead. Trackunit distinguishes between operating hours (engine on) and “work day hours,” which represent the first and last activity registered throughout the day, specifically because total operating hours do not always uncover the full time the machine was used.
How much of operating time was productive versus wasted?
This is utilization as efficiency. Trackunit’s report can split operating hours into working hours (productive operation) and idling hours (operating without a useful purpose), when the underlying machine data supports it.
Even if you never use Trackunit or a similar platform, these three questions are a useful mental model because they map directly to how utilization improves in construction. You do not improve utilization by “getting the number up.” You improve utilization by deciding which of these questions you are answering, and then fixing the constraints that show up.
There is a reason high-performing fleet organizations bring targets into utilization early. Without a target, utilization is descriptive. With a target, utilization becomes directional.
Trackunit’s Utilization Report calculates total anticipated usage based on the daily utilization target multiplied by the days in the selected date range. That is a simple idea, but it is powerful because it creates a consistent baseline you can review week over week.
This also aligns with how many construction businesses think about equipment cost recovery. Construction Equipment defines utilization hours as the hours equipment operates performing construction work, and notes that cost recovery rates should be based on a planned number of utilization hours per year for each type of equipment. If utilized hours are less than planned, the cost of the equipment for the year is not recovered.
Put those together and you get a practical operating principle:
If you cannot state your planned utilization for a machine category, you cannot reliably answer whether the fleet is right-sized, whether ownership is justified, or whether redeployment is urgent.
Targets do not need to be perfect to be useful. They need to be stable enough to expose trends. In construction, stability beats sophistication. A “good” target is one your organization will actually use consistently across projects and regions, and one that reflects how the work is performed.
Telematics has made it easier to track operating hours across large fleets. That is progress, but it can also create a false sense of precision. Engine-on time is not the same as productive time, and it is not the same as planned availability.
The classic productivity framework makes that clear. West Virginia University’s machine time model defines Scheduled Machine Hours (SMH) as the time the machine is scheduled to work, and Productive Machine Hours (PMH) as the time the machine actually performs work, excluding time lost to both mechanical and non-mechanical delays.
That distinction matters because it prevents the most common utilization mistake: treating “telemetry hours” as “productive hours.”
Trackunit’s inclusion of work day hours is a good example of how software can help teams interpret operating hours more carefully. In the utilization report, operating hours are defined as the hours where the machine’s engine was on, while work day hours represent the first and last activity registered throughout the day. Trackunit explicitly recommends using the combination because operating hours alone do not uncover the full time the machine was used.
In practical terms, this helps answer questions that construction teams face every day:
Was the machine present and in use for the full shift, even if engine-on time was low?
Was it on site and “in the way” all day, even if operating time looked reasonable?
Is the machine being staged correctly, or are we extending the workday with avoidable handoffs?
This is what thought leadership in utilization looks like. It is not “use the asset more.” It is “measure time in a way that matches how work actually happens.”
If you want to improve utilization without adding risk, idle is often the cleanest starting point.
Idle does not just waste fuel. It consumes service intervals, increases wear, and hides operational inefficiency behind the appearance of activity. This is why separating working and idling hours matters.
Trackunit’s Utilization Report describes working hours as when a machine is operating productively, and idling hours as when a machine is operating without a useful purpose. When you can see that split, utilization stops being a debate about whether the machine was “used,” and becomes a conversation about what kind of time it accumulated.
This is also where the jobsite becomes part of the utilization equation. High idle often points to constraints outside the machine: truck imbalance, access restrictions, loading queues, poor layout, sequencing delays, or rehandling. These are operational problems that show up as utilization losses.
The important point is that utilization improvement is rarely a single lever. It is usually a coordination win.
Most utilization reviews spend too much time in the middle.
The fastest decisions are usually at the edges: equipment that is unused, and equipment that is heavily utilized.
Trackunit’s Utilization app is designed around that reality. It is positioned as a way to gain visibility into how assets are being used so it becomes easier to optimize operations, reduce costs, and increase uptime. It highlights two use cases that matter in any construction environment: identifying unused assets and avoiding over-utilization that could lead to breakdowns and downtime.
The visualization choices reinforce that focus. The app uses a color-coded map (unused, normal usage, heavily utilized, and not available) and supports filtering by site, period, hour interval, and asset type. The goal is not to produce a perfect utilization number. The goal is to shorten the time from insight to action.
Again, you do not need Trackunit to adopt the principle. Any utilization approach that cannot quickly answer “what is idle” and “what is overloaded” will struggle to produce operational change.
There is also an important data discipline embedded here. Trackunit notes that assets classified as “N/A” mean no utilization data is available for the selected period, and that when utilization data is missing, other features such as Insights and Reports can be affected because they rely on the same data inputs.
That is not just a troubleshooting note. It is a reminder that utilization is only as strong as the data pipeline behind it. If you are serious about utilization, you also have to be serious about data completeness.
Benchmarking is where utilization becomes operational. Without a benchmark, utilization is descriptive. With the right benchmark, it becomes directional, helping you decide when to redeploy, resize, rent, or invest.
The mistake is chasing a single external number. Construction utilization is contextual. A machine can be underutilized and still be the right asset to hold for resilience, phase changes, or critical path risk. The goal is not to maximize utilization. The goal is to make utilization intentional.
A practical benchmarking approach has three layers.
1) Start with an internal benchmark: actual versus planned utilization
The most defensible benchmark is the one tied to how the fleet is sized and paid for. Planned utilization hours represent the level of productive work the business expects from each equipment category. Measuring actual utilization against that plan turns utilization into a management signal. It makes gaps visible early and forces clarity: is the plan wrong, is deployment wrong, or is execution constrained?
2) Segment before you compare
Fleet-wide utilization averages hide the truth. Benchmarking only becomes meaningful when you compare like with like. Segment by asset type and size, then by operating context such as site, region, and project phase. This is how you avoid false conclusions, for example comparing a specialty machine used in a narrow project window with a production asset expected to run daily.
3) Use external benchmarks as directional context, not a target
External benchmarks can be useful, but only when definitions align. If two organizations calculate utilization differently, the comparison creates noise. Use external benchmarks to sense-check trend and competitiveness, not to set a universal target. The closer your definitions are to a consistent time model and consistent data inputs, the more useful external reference points become.
The output of benchmarking should be a decision, not a report. Underutilization should trigger redeployment, substitution with rental, or a change in fleet mix. Overutilization should trigger protection of critical machines, maintenance planning, and capacity review. When benchmarking is reviewed regularly and acted on, utilization becomes a lever for fleet performance, not just a KPI.
There is one problem that sits underneath almost every utilization initiative in construction: most fleets are mixed. Most data is not.
When every OEM speaks a different data language, utilization becomes harder to define consistently, harder to benchmark, and harder to improve. It also becomes harder to trust. Teams spend time reconciling reports instead of making decisions.
This is why ISO standards matter in utilization conversations, even if they feel far away from day-to-day operations. ISO/TS 15143-3 specifies a communication schema designed to provide mobile machinery status data from a telematics provider’s server to customer applications via the internet, with data elements intended for analysis of machine performance and machine management status related to operation and maintenance.
In plain terms, it is part of the foundation for consistent mixed-fleet visibility. Standardization is what lets you build one utilization model and apply it across brands, regions, and projects without rebuilding the logic every time the fleet changes.
Turning utilization into an operating rhythm.
Utilization is not about having the best dashboard. It is about turning utilization into a repeatable operating rhythm.
Trackunit is one example of how software can support that rhythm: a utilization report that can be segmented by customer, group, site, or asset; target-based reviews that highlight over and underuse; and the ability to interpret engine-on time through additional lenses like work day hours and productive versus idling hours. The Utilization app adds a fast way to spot unused and heavily utilized assets and to filter the view by the dimensions that matter operationally.
If you want better fleet utilization, aim for a utilization system that can answer three questions consistently:
When those questions can be answered quickly and confidently, utilization stops being a KPI you report. It becomes a decision engine.