Unlock Sustainability

Let data lead the way to
sustainability outcomes

Trackunit offers automated, usage-based tracking that unifies emissions data from every machine, site, and region so you can operate with confidence, ensure compliance, and thrive in the construction industry.

Aerial view of a yellow bulldozer on sandy ground with a green overlay showing “Emission: ~162gCO₂e,” illustrating construction IoT.
Solution Benefits

Purpose-built emissions tracking just for construction

Built on real-world insights, adaptable to any data quality, and powered by trusted CO₂ factors — Trackunit’s data model ensures every machine’s emissions are consistently captured and factored.

Emissions Reporting

Emissions made visible, so you can take action to transform results

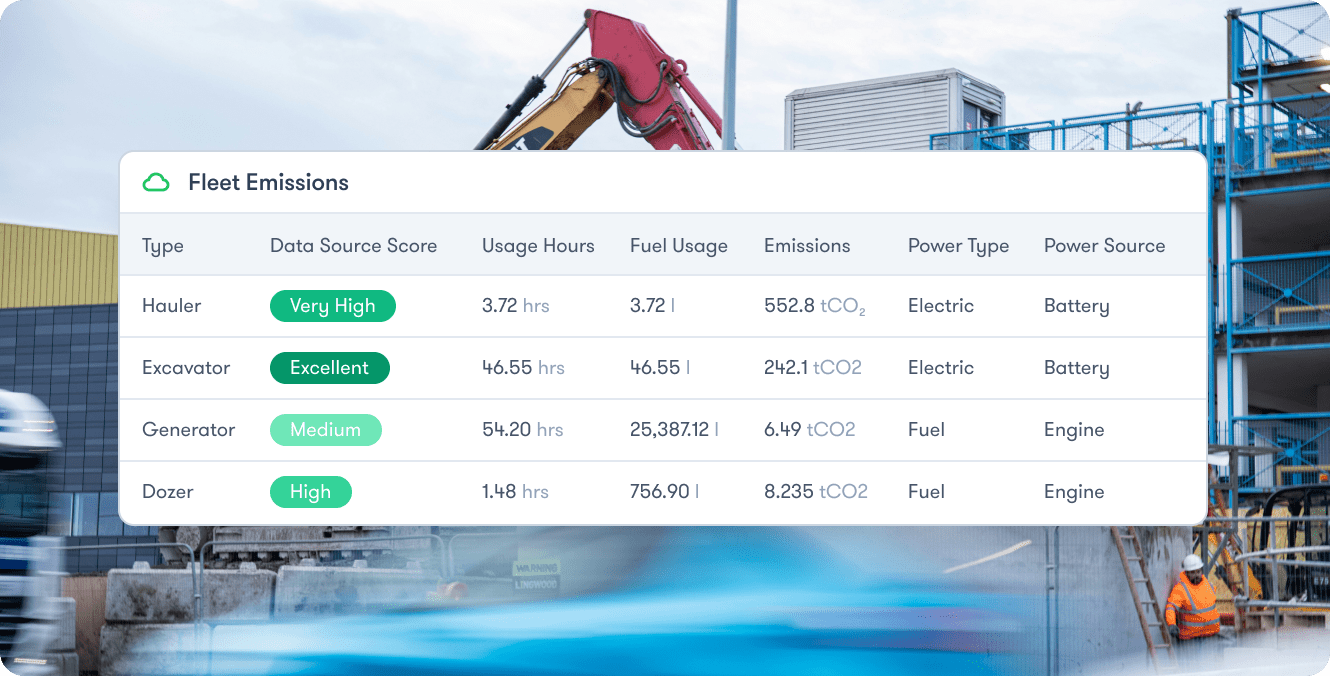
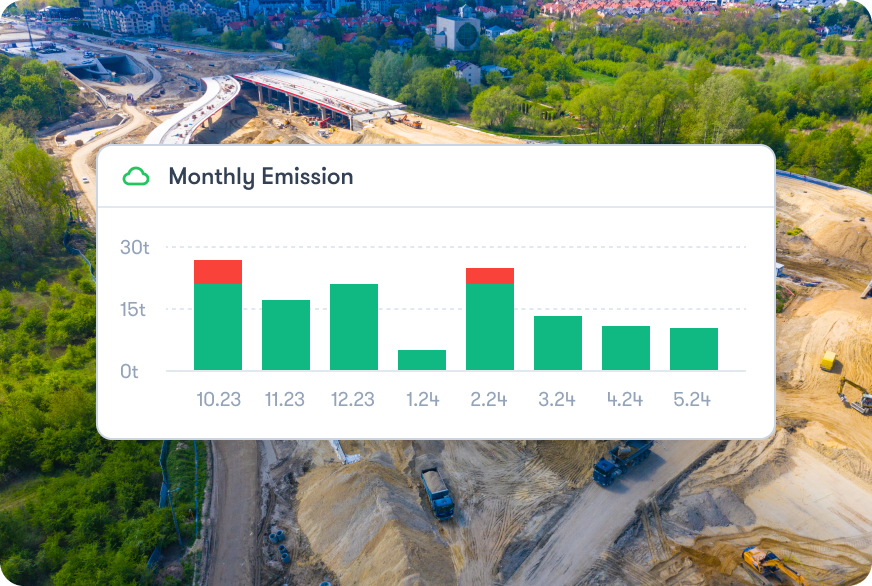
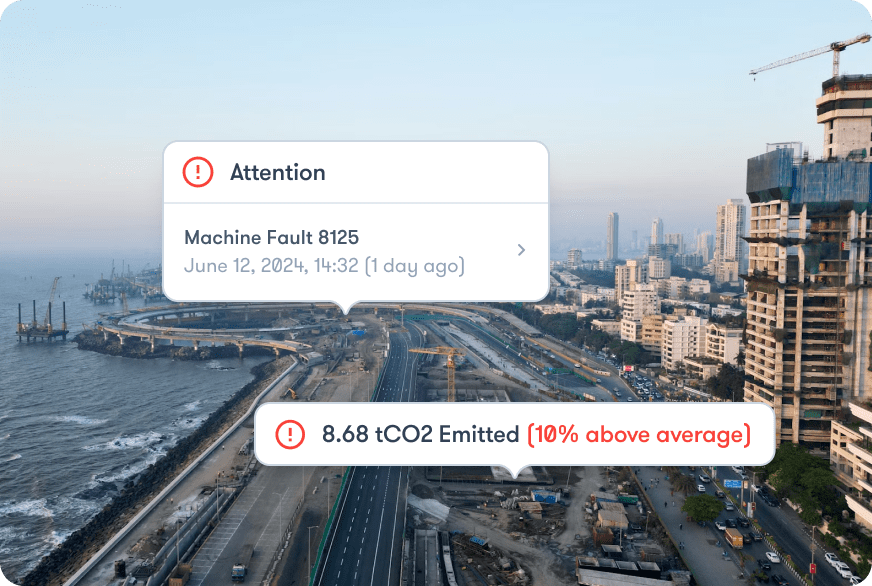
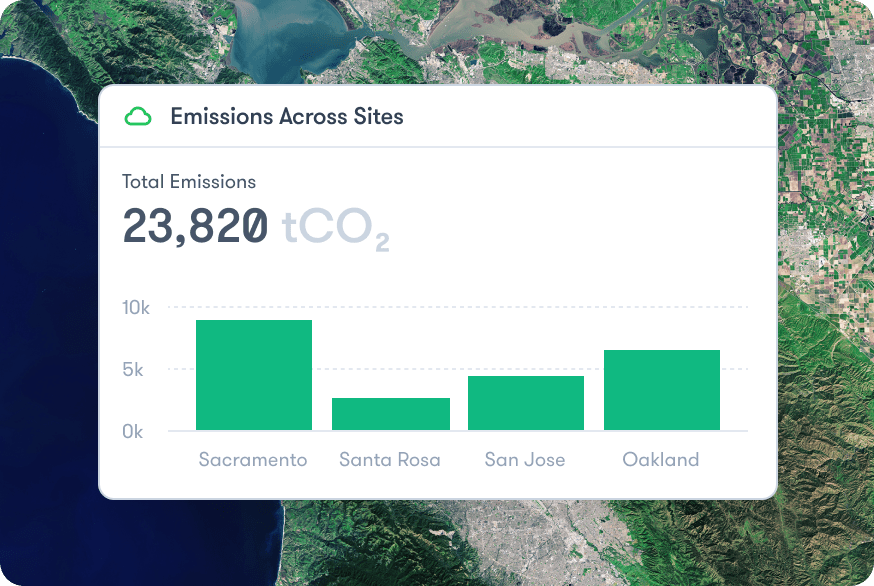
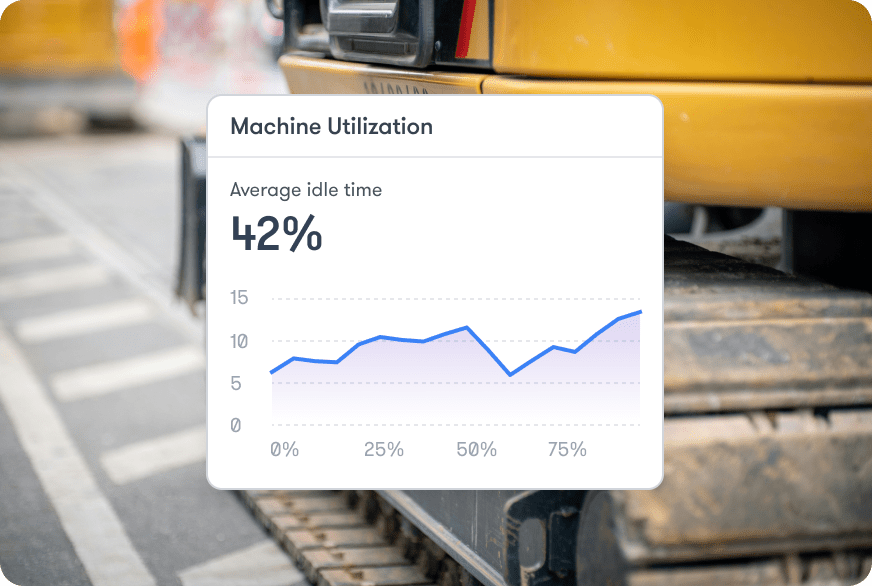
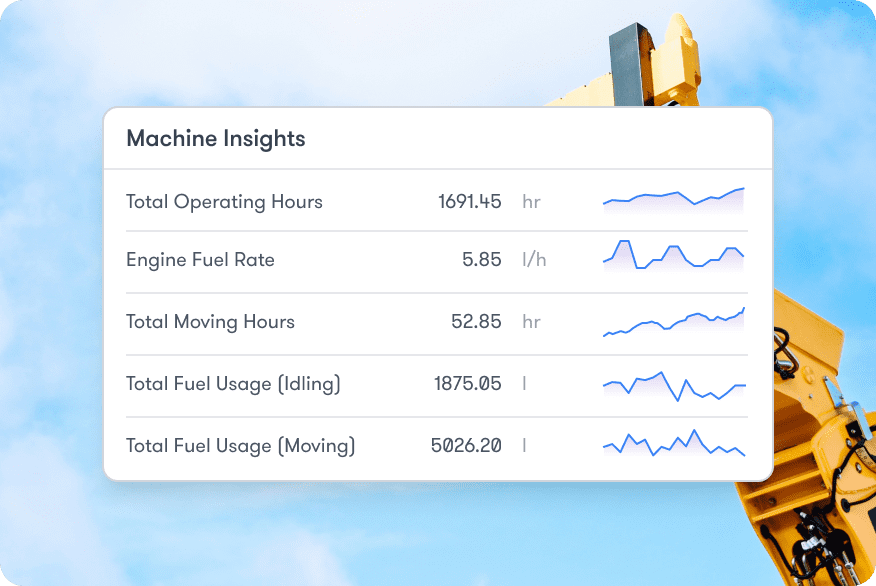
Track and reduce equipment emissions while saving on fuel with Trackunit’s Emissions Reporting. This comprehensive platform leverages continuous machine data and fleet-wide analysis, enabling you to monitor, manage, and report fuel use and emissions to meet your business and sustainability goals.

A digital dashboard shows fleet emissions data over a blurred construction site, highlighting vehicle stats for connected jobsite insights.

Complete visibility

Drill down or across the fleet

With fuel and emissions tracking per asset or across your entire fleet, you can drill down or across the fleet to know exactly where things stand with emissions, plus eliminate time spent on manual guesswork.

A yellow wheel loader moves dirt on a construction site, with tags for other equipment, highlighting construction equipment tracking.

Mixed fleet coverage

No machine left behind

With emissions tracking across every make & model of construction equipment, including fuel and electric, you can rest assured that we’ve captured each and every one of your connected asset types.

A dump truck and excavator work at a rocky quarry site; an alert shows CO2 emissions 18% above average. Construction IoT shown.

Green fleet

Spot and replace high emitters

With total monthly emissions and asset-level details you can quickly spot high-emission machinery and replace it with cleaner alternatives to adhere to project and site targets, plus drive operational efficiency and sustainability.

A man in a pink shirt uses a laptop outdoors by a blue industrial bin, viewing emissions data and metrics for construction IoT.

Value driving data

Unlock hidden insights

With data filtering by equipment type, operating hours, fuel and energy used, plus more, unlock instant insights to realize cost-savings and drive business value.

Emissions Reporting: Data Scoring

How Data Scoring works

Trackunit Emissions Reporting includes a score for each asset to highlight if action is required to improve data inputs to get more accurate emissions numbers across the fleet. Users can follow these easy steps to quickly boost the accuracy of emissions measurements.

Aerial view of a construction site shows trucks and machinery with data scores; panel displays medium score for 253 assets. Construction IoT.

Step 1

Score check

Check the Data Scoring dashboard for a full fleet score.

Step 2

Drill deeper

Drill down into asset-level scores from excellent to low.

Step 3

Take action

Take action to get a higher score by updating asset meta data or connections.

Step 4

Your winning score

Achieving an excellent score means no further action is required and you are getting the most accurate emissions estimates.

Sites

Track your emissions wherever your equipment operates

Surface key insights with fuel and emissions tracking spanning your entire construction fleet—across job sites, depots, or areas you define—all to win contracts and keep projects on track.

Monthly Emission bar chart overlaid on an aerial view of a construction site, highlighting emissions data relevant to connected jobsite.

Stay compliant

Meet regulations,
avoid costly penalties

Accurately measure carbon outputs to maintain compliance, safeguard your reputation, and free your projects from fines or potentially costly disruptions.

Coastal cityscape with highways, tall buildings, and two alerts—one for machine fault, one for emissions; fits construction IoT.

Real-time visibility

Spot issues early,
control equipment usage

Gain insight into each machine’s performance across multiple sites, quickly troubleshoot problems, and schedule maintenance before downtime occurs.

Data card with total emissions of 23,820 tCO2 across four cities, bar chart comparison, and satellite map—relevant for fleet management.

Insight-fueled growth

Turn emissions data
into strategic opportunities

Harness complete fleet-wide emissions tracking for data-driven decisions—like downsizing or adopting cleaner machines—cultivating long-term sustainability, competitive advantage, and lasting success.

Efficiency unleashed

Reduce fuel consumption and costs

25%

Reduction in diesel consumption by analyzing real-time data across mixed-brand fleets and machine-level insights paved way for targeted fuel-saving measures.

Wins bids to stay in the game

65%

Of contractors cite data-backed sustainability efforts as a key factor in awarding bids, underscoring the market advantage of real-time emissions insights.

Save across every jobsite

15%

Of sites using automated telematics and analytics saw average fuel savings of 15% and a corresponding decrease in CO₂ emissions after implementing dashboards.

Utilization

Every minute of idling
is a missed chance

With utilization reports, surface key insights to optimize machine usage driving performance and productivity every day.

Close-up of construction equipment with a digital line graph overlay showing 42% idle time, relating to fleet management.

Actionable usage

Uncover daily machine performance

Compare operating hours against expected targets to reveal underutilized machines, reduce downtime, and maximize efficiency across every jobsite.

Digital dashboard labeled Machine Insights showing equipment metrics and line graphs, with a construction machine in the background; construction IoT.

Idle insights

Expose non-productive machine hours

Track idling to cut wasted fuel and emissions, ensuring more precise project timelines, lower costs, and boosted sustainability.

A woman with curly hair works on a laptop at a red desk, viewing fleet management utilization and idle time charts in an office.

Emissions impact

Optimize usage for lower carbon footprint

Combine usage and idle data with emissions reporting to measure real impact, meet regulations, and strengthen your brand’s sustainability leadership.

Join the best in business

Trusted by leading OEMs, rental companies, contractors, and partners to unlock the full value of their fleets and equipment.

A grid of equipment rental company logos, such as GSV, MANITOU, LOXAM, and more.

Request a demo

Products

Discover all your
possibilities

Experience a world of opportunity by plugging into construction.

Trackunit® Manager
Work smarter with full fleet intelligence

Say goodbye to fragmented views by using the #1 chosen interface in the industry to connect, collect, and present all your equipment insights in a single platform

Trackunit® App Marketplace
The hub to connect and create

The Marketplace is a hub for partnership, co-creation and creativity that facilitates new digital construction experiences.

Resources

Dig deeper into
sustainability

Keep up to date on news surrounding the platform’s capabilities,
development, and the technology behind it.

Webinar

Trackunit IrisX - Extend your digital experiences and value across your customers and teams

Experience how IrisX can transform data into productivity gains, automated operations, and new revenue opportunities.